Let’s dissect this graph like a packet capture at 2 a.m.
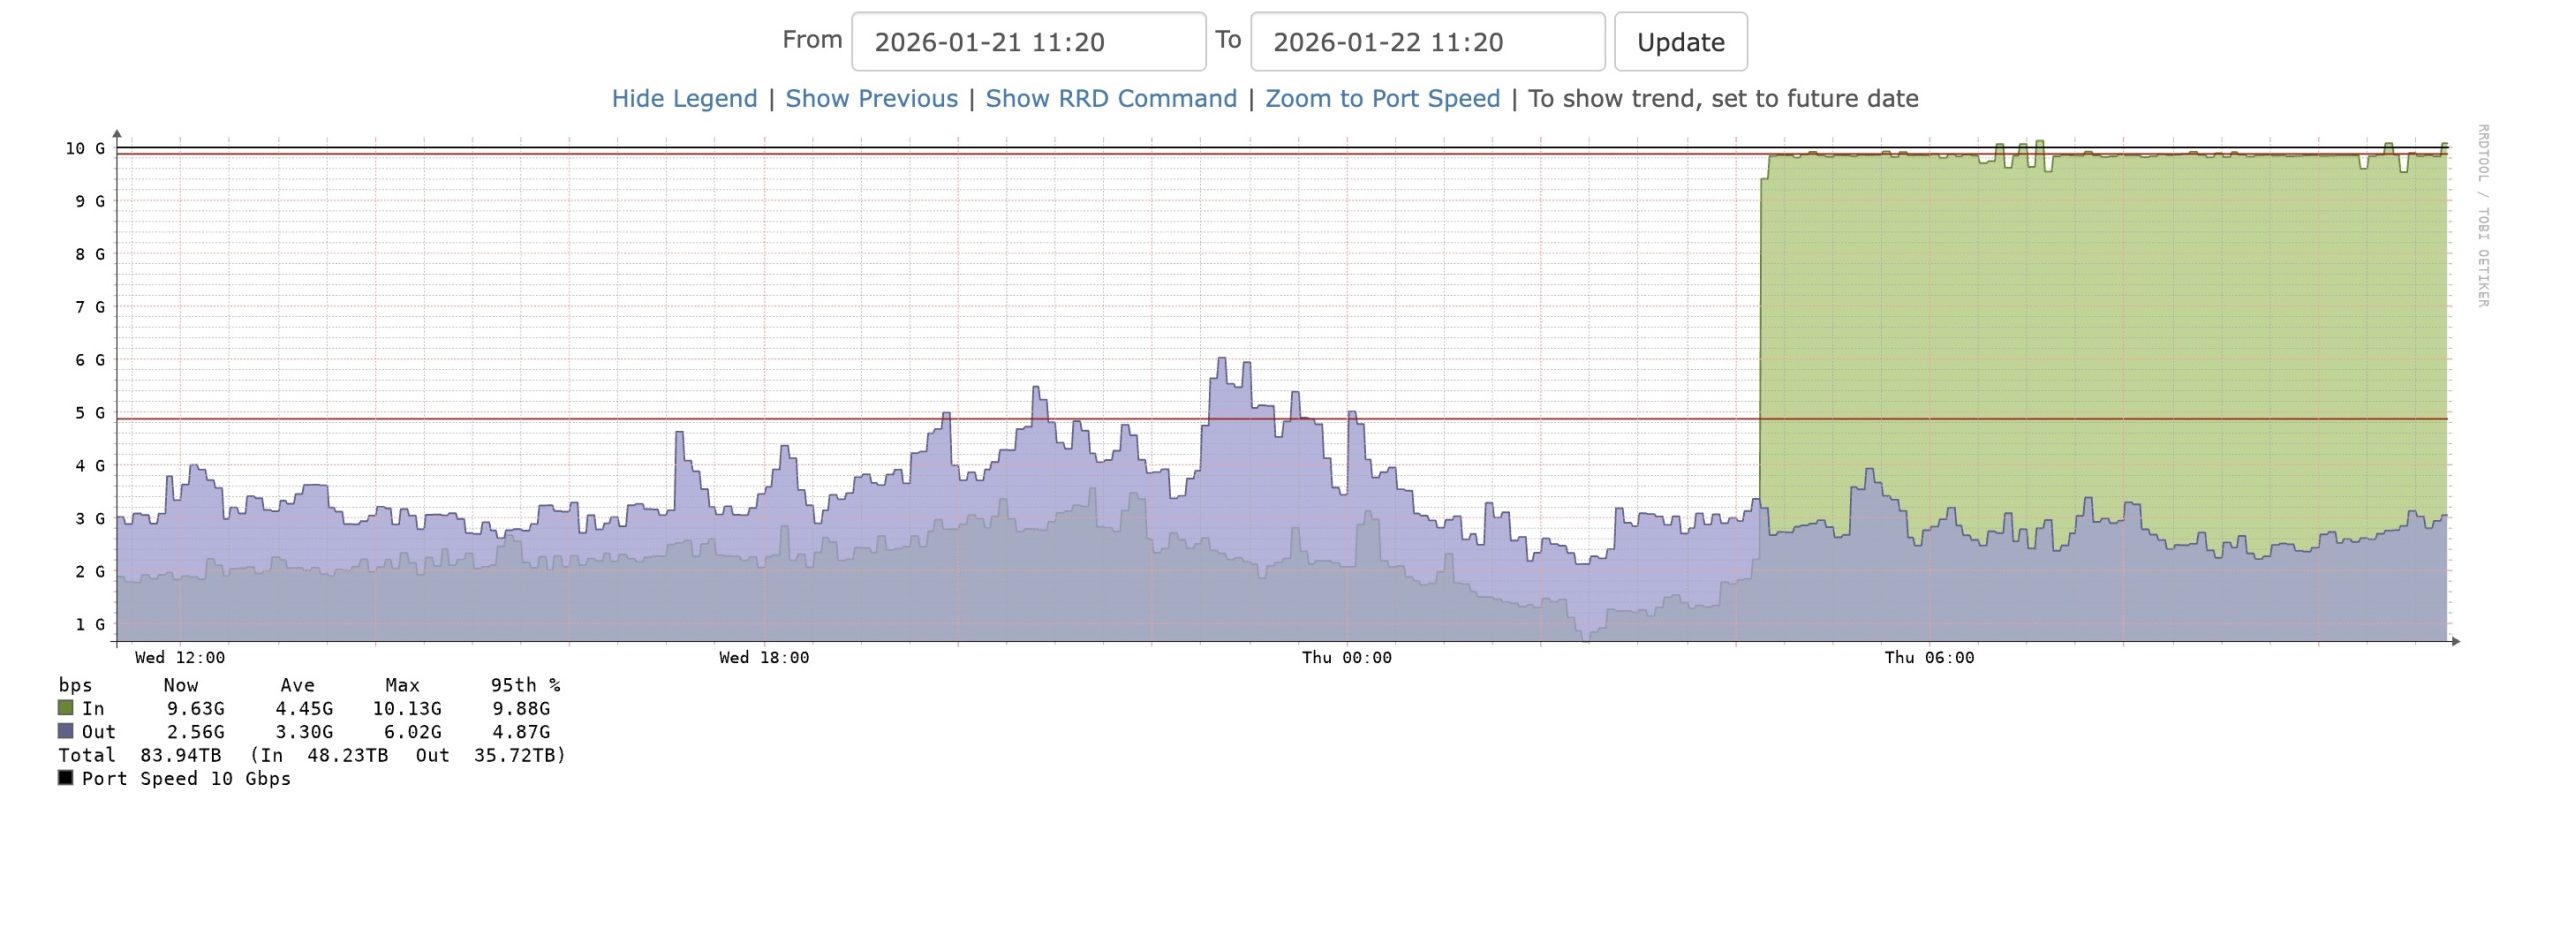
At first glance, it looks like a normal 10G port doing normal 10G port things. Traffic floats between 2 and 5 Gbps. Inbound and outbound move with some rhythm. Peaks rise, then fall. Nothing dramatic. This is what healthy Internet traffic feels like.
Then something changes. In the early hours of Thursday, inbound traffic reaches the 10 Gbps maximum and remains at that level. This customer only has a 10G port. This is not a transient spike or burst, but a sustained plateau. That green block pinned to the top? That’s not growth. That’s saturation.
Welcome to the anatomy of a DDoS attack.
First: The Baseline
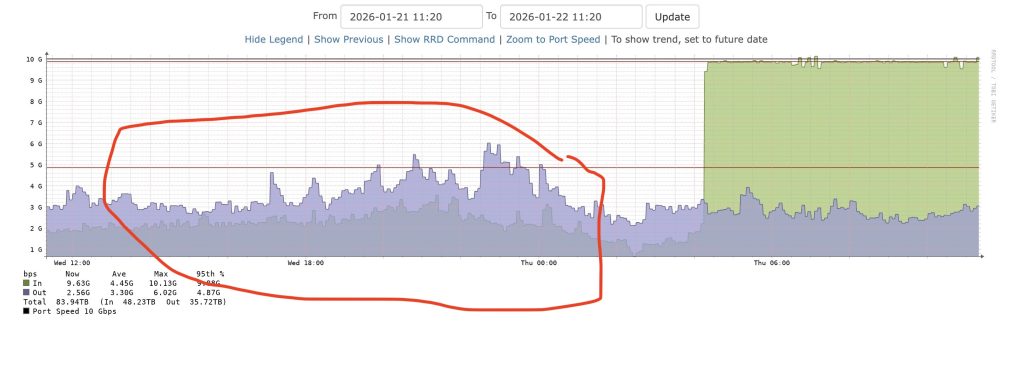
Identifying a DDoS attack requires an understanding of normal network behavior. In the left portion of the graph, inbound traffic averages approximately 4.45 Gbps, with peaks approaching 10 Gbps. Outbound traffic averages around 3.3 Gbps. There’s variance. A network acts like a living organism in many respects. Normal traffic increases during peak usage hours and decreases during periods of low activity. Occasional spikes may occur due to large uploads or popular content releases. However, it does not remain at maximum port capacity for extended periods.
Second: The Trigger
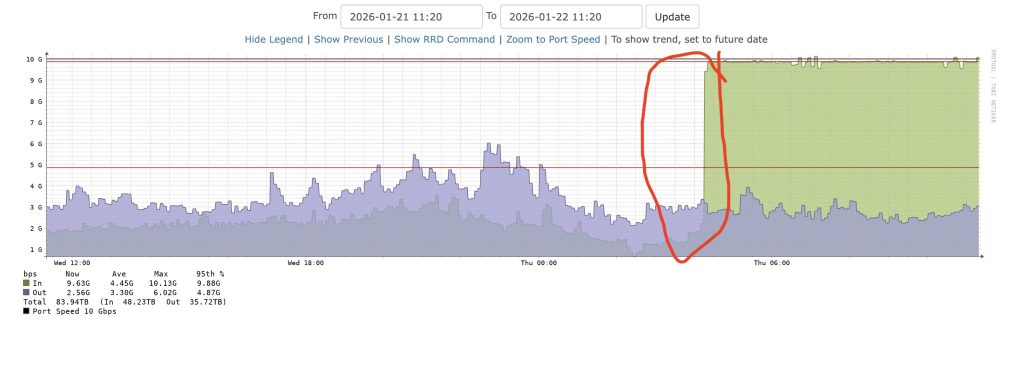
Notice the moment the inbound traffic jumps and sticks at 9.6+ Gbps. That’s your trigger point. During a DDoS attack, many compromised devices across the Internet direct traffic toward a target IP address. This traffic may utilize techniques such as UDP amplification, SYN floods, HTTP floods, DNS reflection, or hybrid methods. While the specific method varies, the resulting effect at the physical layer is similar.
You hit the physical limit. The 10G connection becomes saturated with unwanted traffic. When traffic remains at the line rate, this indicates resource exhaustion rather than legitimate demand. At this stage, the attacker is overwhelming the network rather than merely probing it.
Third: Saturation
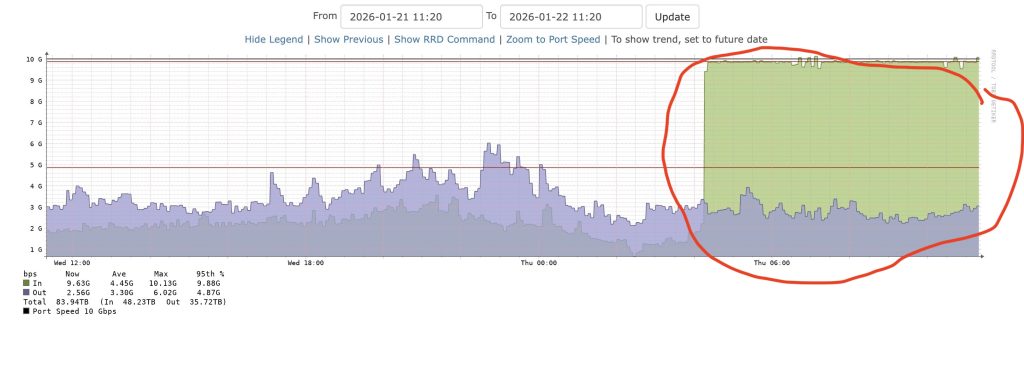
Inbound traffic remains consistently at 10 Gbps, while outbound traffic is significantly lower. This asymmetry is characteristic of volumetric DDoS attacks. Legitimate user traffic typically exhibits symmetry, with requests and responses flowing in both directions. Anyone who has looked at these graphs long enough knows there are pretty consistent patterns. Even streaming services generate feedback flows. In contrast, volumetric DDoS attacks often generate substantial inbound traffic with minimal outbound traffic, as the target is unable to respond to most requests or the traffic consists of unidirectional, spoofed packets, such as UDP.
The red line indicating port speed represents the maximum observable throughput. Any traffic exceeding this threshold is not visible in the graph; for example, if 15 Gbps is sent, only 10 Gbps is observed, with the remainder dropped upstream. That means what you see on the graph is the capped symptom, not the full force of the attack.
Fourth: Collateral Damage
When a port is saturated, legitimate packets are queued or dropped, causing TCP session resets and service disruption, such as VoIP. This often leads to customer complaints and alerts from monitoring systems. From a network engineering perspective, the primary concern is not the high traffic volume, but the sustained flat line at maximum capacity.
A flat line at capacity means you have lost all breathing room. The network cannot absorb variance. Any new legitimate flow competes with all the other packets. Think of it like a freeway. Normal rush hour is heavy but flowing. A DDoS is someone dumping concrete into every lane at once.
Fifth: The Aftermath
When the attack stops, traffic drops back to its baseline pattern. The graph regains texture. Peaks and valleys return. The network breathes again. A DDoS attack is not merely an increase in traffic volume; it is specifically engineered to eliminate network margin, target capacity, and exploit the finite nature of bandwidth.
There is a philosophical lesson here. The Internet is built on cooperation. TCP assumes good behavior. Routing assumes policy. DNS assumes honesty. DDoS exploits the trust and openness baked into the system. A botnet with 50,000 nodes sending 200 Kbps each creates 10 Gbps. That’s pocket change for compromised IoT devices. The attack does not require much smarts. It requires distribution.
Defending against this means pushing the fight upstream. Scrubbing centers. Anycast. Rate limiting. BGP blackholing. Capacity overbuild. Fast detection. You cannot firewall your way out of a saturated circuit. Once the pipe is full, it’s too late. There is also a fine line between manual intervention and automation. One cannot be quick, and the other can be too heavy-handed.
The graph you’re looking at is a reminder that networks are physical systems with limits. It is a crowd turned into a weapon. And the only real defense is preparation.
j2networks family of siteshttps://j2sw.com
https://startawisp.info
https://indycolo.net
#packetsdownrange #routethelight
Discover more from Justin Wilson (j2sw)
Subscribe to get the latest posts sent to your email.